
Why Dashboards Rarely Show the Real Bottleneck
WRITTEN BY
Fabian Matamoros
Published
Mar 12, 2026
Read time
6 min read
Most operational dashboards answer an important question: "Did we hit the target?"
They track SLA compliance, QA scores, revenue, throughput, handle time, backlog levels, and other performance indicators. When the numbers look healthy, leadership usually assumes the operation itself must also be healthy.
Early in my career running operations, I believed this as well.
If the dashboard looked good, I assumed the system behind it was working.
But after running teams long enough, you eventually discover something uncomfortable.
Many operational bottlenecks never appear in the dashboard at all.
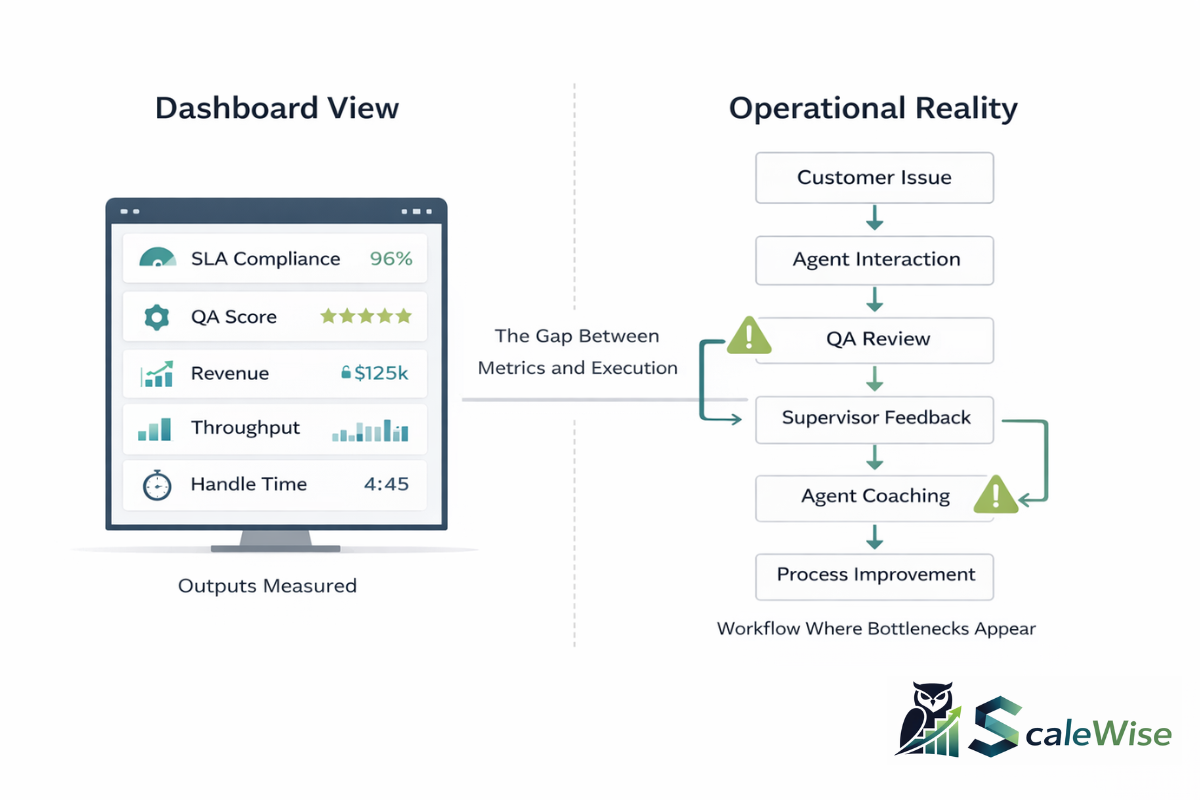
Dashboards measure results. Most execution problems happen in how work moves between those results.
Dashboards measure outputs. Bottlenecks usually live in the movement of work.
What Dashboards Are Actually Designed to Measure
Dashboards exist for good reasons. They provide visibility into outcomes and help organizations monitor the health of their operations.
Metrics such as SLA compliance, QA scores, revenue, throughput, backlog size, and handle time allow leaders to see whether performance targets are being met.
However, these metrics are almost always end-of-process measurements.
They tell you what happened, but they rarely explain how the work actually moved through the system to produce those results.
Over time I began to notice that most operational friction didn't appear directly in the metrics we reviewed every week. Instead, it showed up in areas such as:
- workflow handoffs between teams
- supervision capacity
- exception handling
- feedback loops between QA and agents
- task placement within teams
- coordination overhead between departments
These structural elements shape the daily reality of running an operation, yet they rarely appear directly in the dashboards executives review.
When the Dashboard Improves but the Operation Doesn't
One of the first clues that dashboards don't tell the full story appears when the numbers improve but the operation doesn't actually feel easier to run.
I remember sitting in weekly reviews where the metrics looked great. SLA compliance was improving and quality scores were trending up. On paper, everything suggested we were becoming a stronger operation.
But inside the floor, supervisors were still overwhelmed. Escalations kept appearing. We were still spending time resolving the same issues again and again.
The numbers suggested progress, but the day-to-day experience of running the operation hadn't changed much.
That was the moment I started realizing that the dashboard was showing the result, but not the structure of the system producing that result.
A Pattern I Saw While Running a Growing BPO Operation
This dynamic became especially clear while leading a startup BPO operation during a period of rapid growth.
From a dashboard perspective, the operation looked healthy. SLA compliance remained strong, QA scores were solid, and hiring pipelines were consistently bringing in new agents as we expanded.
If someone had looked only at the dashboard, they would have assumed the system was working well.
But inside the operation we kept noticing something frustrating.
The same mistakes were appearing again and again.
Agents would struggle with certain situations, QA would flag the issue, and a few weeks later we would see the exact same mistake show up again in new interactions.
At first, it was confusing. We were measuring quality carefully, and the metrics themselves looked strong.
But the operational reality told a different story.
The Moment We Realized the Problem Was the Feedback Loop
Eventually, a simple observation made the issue obvious.
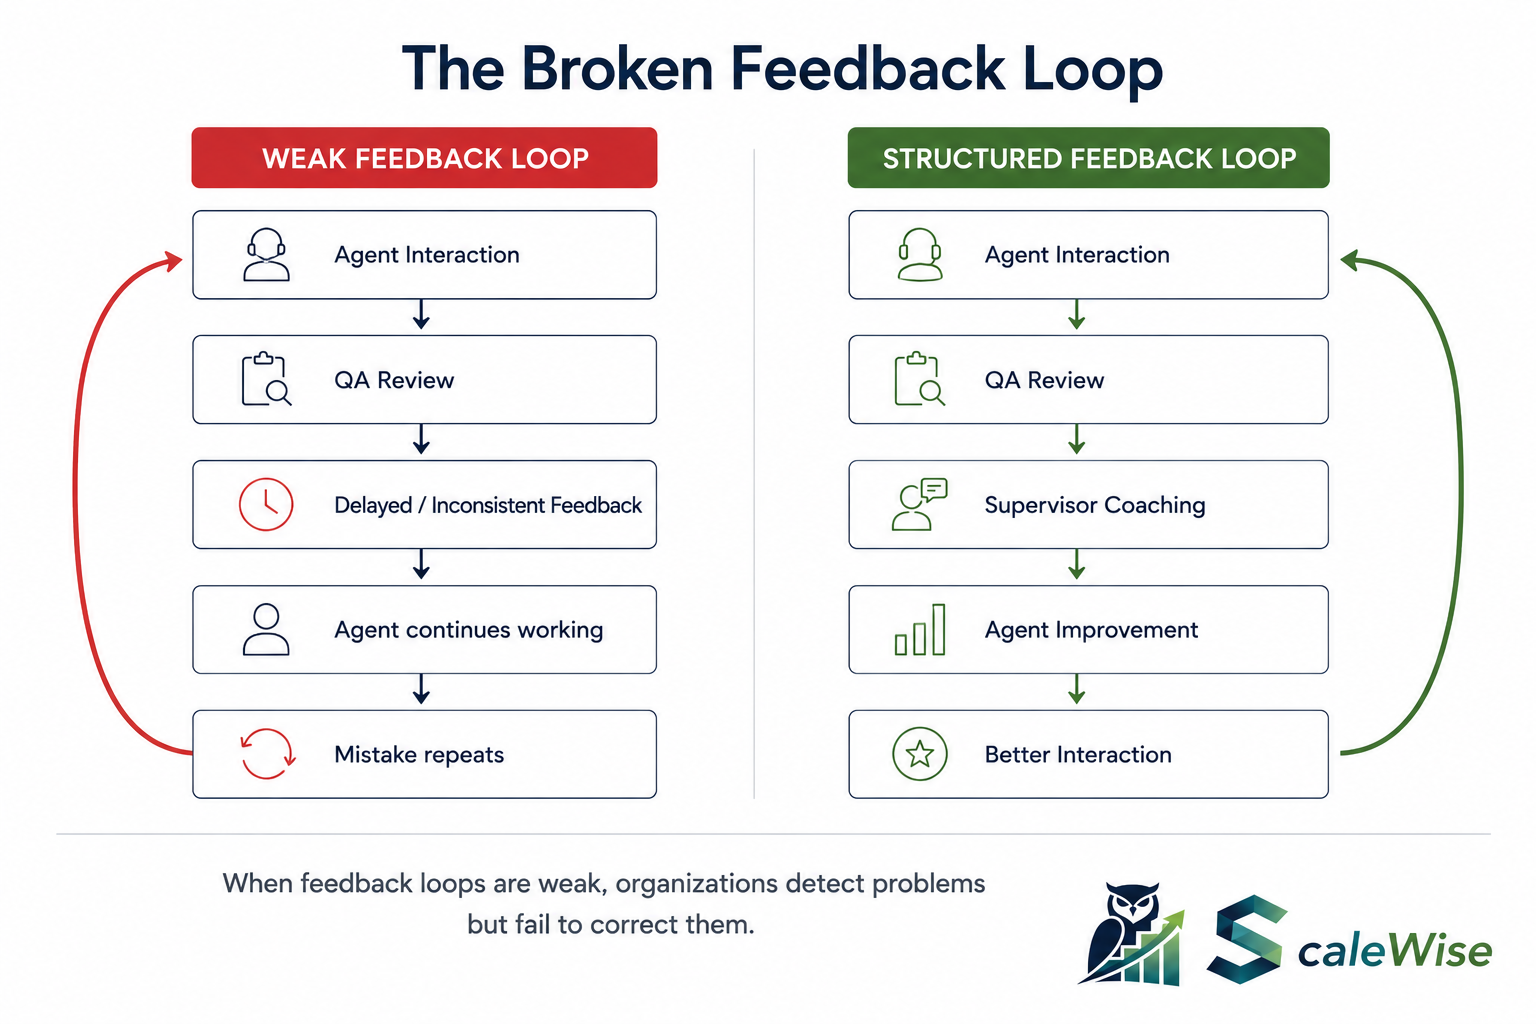
We were very good at detecting mistakes, but not very good at correcting them systematically.
QA was consistently grading interactions and identifying issues. From a measurement perspective, the system was doing its job.
But the feedback loop between QA and the agents was weak.
Supervisors were juggling hiring, scheduling, escalations, and daily management responsibilities. Coaching sessions happened, but not always consistently. Feedback often arrived days after the interaction had occurred.
The result was predictable.
We would detect the same issue, document it, and then see it show up again several weeks later.
The system had measurement.
It did not yet have a reliable correction loop.
The Structural Change That Fixed It
What finally improved the situation was not a new tool or additional staffing.
We simply changed the rhythm of the operation.
Instead of letting QA grading and coaching happen whenever time allowed, we structured the week intentionally.
Early in the week
QA teams focused on grading interactions and identifying patterns.
Later in the week
Supervisors held structured coaching and feedback sessions with agents.
This small change created a consistent feedback loop. Issues identified early in the week were addressed through coaching before they had time to repeat across dozens of interactions.
Within a few weeks we saw a noticeable improvement in performance.
And importantly, that improvement happened without increasing headcount.
The bottleneck had not been agent capacity.
It had been the flow of feedback through the system.
Other Situations Where Dashboards Hide the Real Problem
That experience also helped me recognize similar patterns in other operational situations.
For example, I remember periods where our SLA compliance looked excellent while customers were still contacting support multiple times for the same issue. Agents were closing tickets quickly enough to satisfy the metric, but the root problem wasn't always being resolved.
I also remember trying to solve queue pressure by hiring more agents, only to discover that the real bottleneck had shifted to supervisors. As teams grew larger, coaching quality declined and coordination became harder, which eventually recreated the same operational pressure we were trying to solve.
Another pattern appeared around QA scores. We sometimes had strong quality ratings while agent performance improved only slowly. Once again, the issue wasn't measurement. The issue was how consistently feedback flowed back into the operation.
Over time I realized the same principle kept repeating.
The dashboard showed the result, but the bottleneck usually lived somewhere inside the workflow behind the metric.
This Pattern Appears Across Many Industries
After seeing this dynamic repeatedly in support operations, I began noticing the same pattern in other environments.
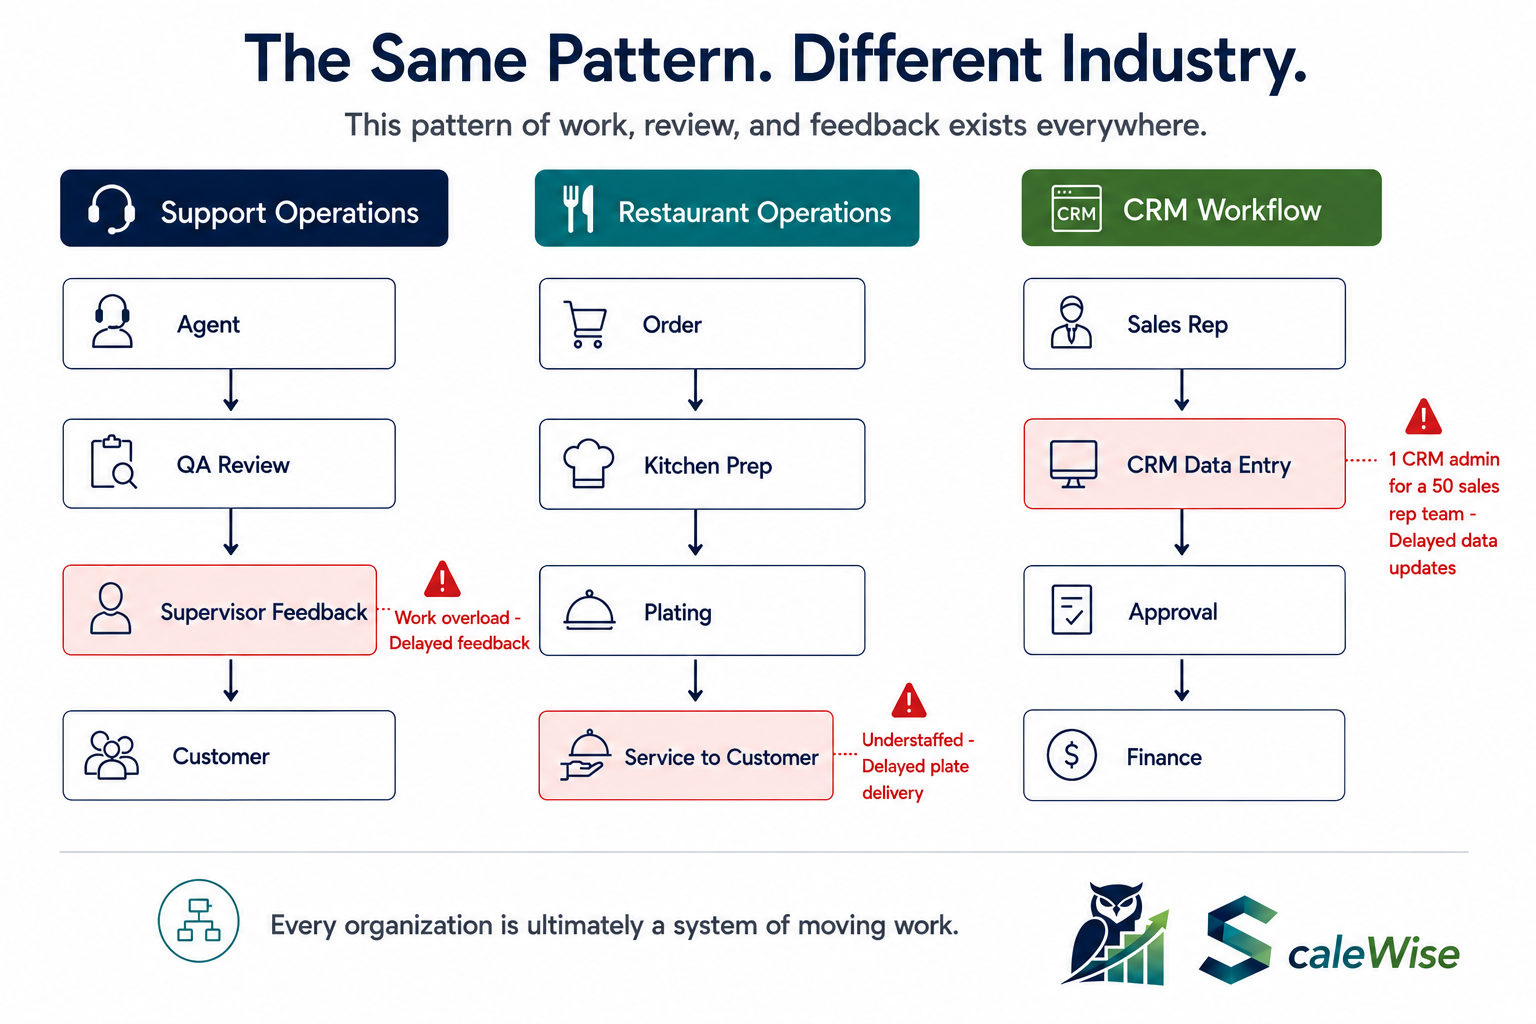
In restaurant operations, revenue dashboards can look strong while kitchen workflow bottlenecks slow service during peak hours.
In CRM implementations, adoption dashboards may show strong usage even while teams quietly create workarounds outside the system to get their work done.
Across industries, organizations often monitor outputs while the real friction exists inside the workflow itself.
Organizations are not collections of metrics.
They are systems through which work moves.
How Experienced Operators Diagnose Systems
Operators who manage complex systems eventually learn to look beyond the dashboard.
Metrics still matter, but they are only one layer of understanding.
Instead of focusing only on performance indicators, experienced operators start asking questions such as:
- Where does work slow down?
- Where do decisions wait?
- Where do supervisors become overloaded?
- Where do mistakes repeat?
- Where does coordination between teams break down?
These questions examine how work actually moves through the organization.
Metrics describe the outcome.
Workflow explains the system that produced it.
The Operator's Rule of Thumb
Dashboards answer an important question: What happened?
Operators must also ask: How did the work move?
And sometimes the most important question of all:
Where did it stall?
Because most operational friction does not appear directly in metrics.
It lives between them.
Closing Thought
Strategy may be sound. Talent may be strong. Metrics may even look healthy.
Yet execution problems often hide in places dashboards cannot see.
Operators who understand this spend time observing how work actually flows through the organization, not just how it is measured.
Because if you truly want to understand an operation, you have to study the workflow, not just the dashboard.